
| 일 | 월 | 화 | 수 | 목 | 금 | 토 |
|---|---|---|---|---|---|---|
| 1 | ||||||
| 2 | 3 | 4 | 5 | 6 | 7 | 8 |
| 9 | 10 | 11 | 12 | 13 | 14 | 15 |
| 16 | 17 | 18 | 19 | 20 | 21 | 22 |
| 23 | 24 | 25 | 26 | 27 | 28 |
- bccard
- mglearn
- java역사
- classification
- C언어
- postorder
- web 사진
- 데이터전문기관
- paragraph
- CES 2O21 참여
- broscoding
- 재귀함수
- Keras
- vscode
- web 용어
- tensorflow
- 자료구조
- web
- discrete_scatter
- 결합전문기관
- html
- cudnn
- KNeighborsClassifier
- CES 2O21 참가
- inorder
- pycharm
- web 개발
- 머신러닝
- 웹 용어
- 대이터
- Today
- Total
목록분류 전체보기 (688)
bro's coding
 sklearn.linearRegression
from sklearn.neighbors import KNeighborsClassifier X=iris[:,:4] y=iris[:,4] knn=KNeighborsClassifier() knn.fit(X,y) knn.score(X,y) knn.predict(X) from sklearn.linear_model import LinearRegression linear=LinearRegression() linear.fit(iris[:,[2]],iris[:,3]) 기울기 = linear.coef_[0] 절편 = linear.intercept_ 기울기, 절편 plt.scatter(iris[:,2],iris[:,3]) plt.xlabel('PetalLength') plt.ylabel('PetalWidth') plt.p..
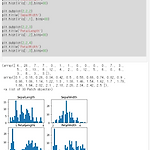 matplotlib.subplot
plt.subplot(2,2,1) plt.title('SepalLength') plt.hist(iris[:,0],bins=30) plt.subplot(2,2,2) plt.title('SepalWidth') plt.hist(iris[:,1], bins=30) plt.subplot(2,2,3) plt.title('PetalLength') plt.hist(iris[:,2],bins=30) plt.subplot(2,2,4) plt.title('PetalWidth') plt.hist(iris[:,3],bins=30)
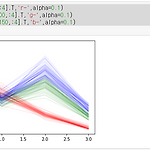 matplotlib.plot
plt.plot(iris[:50,:4].T,'r-',alpha=0.1) plt.plot(iris[50:100,:4].T,'g-',alpha=0.1) plt.plot(iris[100:150,:4].T,'b-',alpha=0.1) pass plt.plot(iris) plt.legend(iris_pd.columns)
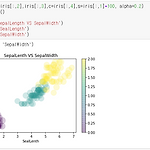 matplotlib.scatter plot
import matplotlib.pyplot as plt plt.scatter(iris[:,2],iris[:,3],c=iris[:,4],s=iris[:,1]+100,alpha=0.2) #우측에 bar표시 plt.colorbar() plt.title('SepalLength Vs SepalWidth') plt.xlabel('SepalLength') plt.ylabel('SepalWidth')
 모듈 구분
모듈 구분
NUMPY MATPLOTLIB PANDAS 수치데이터 분석 정방형 데이터 고차원 데이터 머신러닝 작업 시각화 다양한 그래프 문자/숫자 데이터 2차원 표형태 데이터 데이터베이스 작업 통게 분석 import numpy as np import matplotlib.pyplot as plt import pandas as pd


a.shape=[5,4,3,2,1] a.ndim=5(dimension)
 convert [pandas's data] to [numpy's data]
label = {'Iris-setosa':0,'Iris-versicolor':1,'Iris-virginica':2} iris_df['Name']=iris_df['Name'].map(label) iris=iris_df.values #Pandas 데이터 모두를 Numpy 데이터 형태로 가져온다
