
반응형
Notice
Recent Posts
Recent Comments
Link
| 일 | 월 | 화 | 수 | 목 | 금 | 토 |
|---|---|---|---|---|---|---|
| 1 | 2 | 3 | 4 | 5 | 6 | 7 |
| 8 | 9 | 10 | 11 | 12 | 13 | 14 |
| 15 | 16 | 17 | 18 | 19 | 20 | 21 |
| 22 | 23 | 24 | 25 | 26 | 27 | 28 |
Tags
- web 용어
- web 사진
- classification
- 대이터
- cudnn
- bccard
- web
- discrete_scatter
- paragraph
- CES 2O21 참가
- broscoding
- web 개발
- CES 2O21 참여
- java역사
- postorder
- 머신러닝
- html
- 자료구조
- pycharm
- vscode
- 데이터전문기관
- C언어
- Keras
- tensorflow
- 재귀함수
- inorder
- KNeighborsClassifier
- 웹 용어
- mglearn
- 결합전문기관
Archives
- Today
- Total
bro's coding
AICE.DATA.VISUALIZITION 본문
반응형
시각화Permalink
라이브러리 import
import matplotlib.pyplot as plt
%matplotlib inline
Bar Chart
df[’gender’].value_counts().plot(kind=’bar’)
Object 컬럼 하나씩 가져와서 Bar 차트 그리기

object_list = df.select_dtypes('object').columns.values

for col in object_list:
	df[col].value_counts().plot(kind='bar')
	plt.title(col)
	plt.show()
Histgram
import seaborn as sns
sns.histplot(data=df, x=’tenure’, hue=’Churn’)
곡선 히스토그램 : sns.kdeplot(data=df, x=’tenure’, hue=’Churn’)
Countplot : sns.countplot(data=df, x=’MultipleLines’, hue=’Churn’)
heatmap : sns.heatmap(df[[‘tenure’,’MonthlyCharges’,’TotalCharges’]].corr(), annot=True)
boxplot : sns.boxplot(data=df, x=’Churn’, y=’TotalCharges’)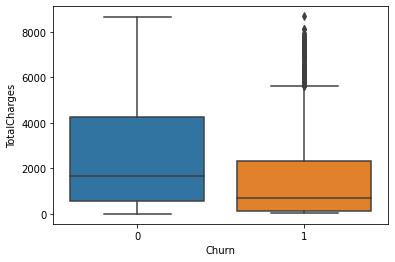
반응형
'[CERTIFICATION] > AICE' 카테고리의 다른 글
| AICE.REF (0) | 2023.07.26 |
|---|---|
| AICE.DNN (0) | 2023.07.26 |
| AICE.NORMALIZITION (0) | 2023.07.26 |
| AICE.ML (1) | 2023.07.26 |
| AICE.DATA.PREPROCESSING (0) | 2023.07.26 |
| AICE.DATA.PREPROCESSING (0) | 2023.07.26 |
Comments